Varig EOS
Easy to use. Clear. Always up to date. No expert needed. Varig EOS shows you what matters.
- ✓Automatic data capture from Electricity, Heating and all energy sources
- ✓Monitored and quality-assured data from day one with no manual work required
- ✓One simple and reliable source of truth for your building

Why choose Varig EOS?
You don't have to be an expert. We make sure everything is setup and connected as it should be. The system shows you what you need to know in a simple and understandable way.
Easy to use
See Electricity, Heating and energy consumption across all your buildings on one screen. Clear and always up to date, with a custom dashboard for your needs.
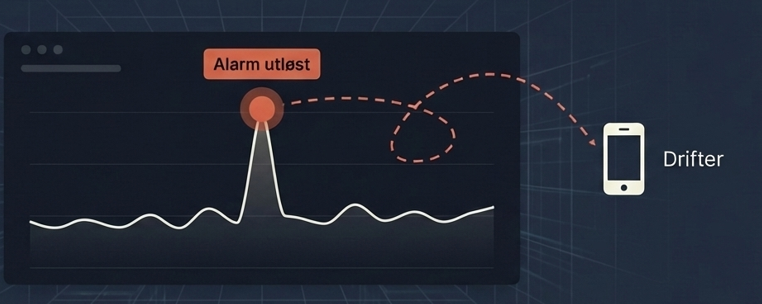
AI Alarms
Varig EOS monitors electricity, heating and energy usage around the clock. If an issue is detected, you will be notified right away so you can act on it before it becomes a problem.
Clear insights
Get insight into how your buildings are performing, log measures and certifications and see the impact of your actions.
Connects to any system
Works with your existing meters, Building Management systems, energy providers and even manual meters. No new hardware required.
Our customers reduce their energy consumption by up to 20% after using Varig EOS. Small adjustments bring big savings.
The Reality of Portfolio Management
You need a system that monitors continuously, not another dashboard to babysit
Without EOS
- ✗Problems stay hidden until bills or complaints show up
- ✗Fixes happen, but impact is unclear or undocumented
- ✗Time gets lost in manual dashboard checking
- ✗Energy data doesn’t translate into measurable kWh impact
- ✗Weather masks performance drift and control issues
With EOS
- ✓Automated deviation alerts (based on your data latency)
- ✓Resolution tracking with clear before/after context
- ✓You manage exceptions, the system does the monitoring
- ✓Each issue includes estimated kWh impact for prioritization
- ✓Weather-normalized baselines reveal true operational change
How It Works
Low setup. Clear signals. Measurable follow-up.
Connect
Connect EOS to your existing meters, BMS/EMS exports, or utility interval data. No new hardware required.
Detect
EOS learns your normal patterns and flags meaningful deviations. Weather normalization included where relevant.
Act & Prove
Assign, resolve, and document outcomes. Keep an audit trail and validate improvement over time.
Inside Varig EOS
Automated AI Alarms
- •Severity rating (Low / Medium / High / Critical)
- •Estimated kWh impact per day/month
- •Filter by site, status, or energy type
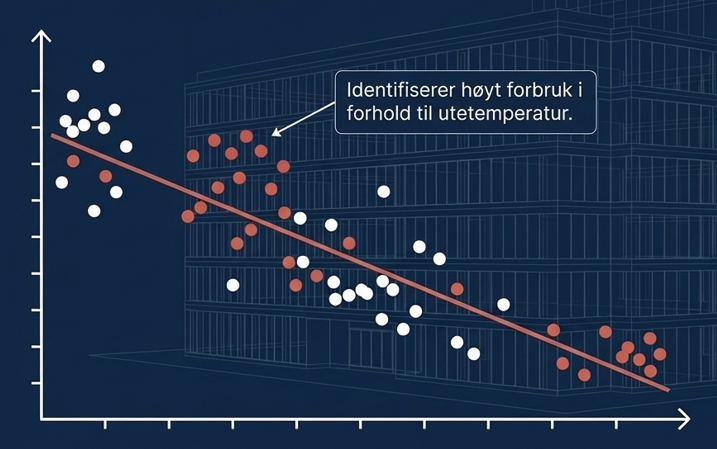
Deep insight with ET-curve: Reveal the building's hidden waste
- •Breaks down the building's energy signature
- •Identifies unnecessary heating
- •Advanced analysis, simplified into a user-friendly interface
Weather normalized graphs
- •Automatic degree-day correction for heating/cooling
- •See real performance changes vs weather-driven changes
- •Toggle view: raw data vs weather-normalized
Energy Performance
Energy Trends
Usage Breakdown
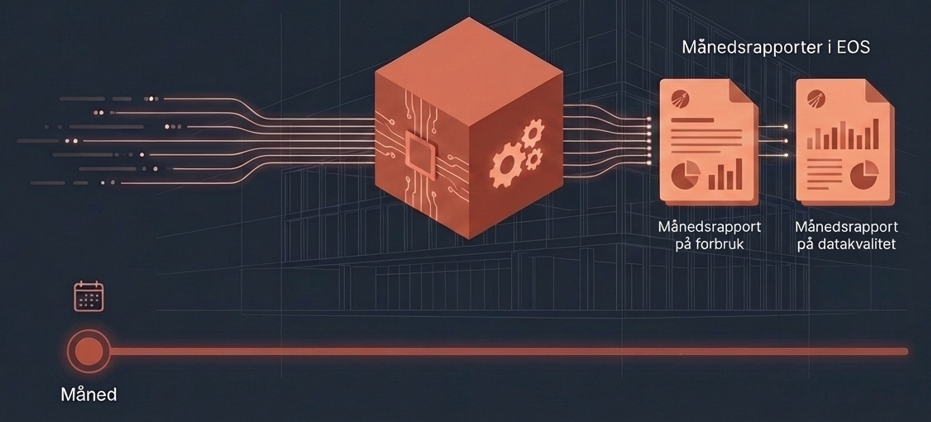
Monthly Report
- •Automated summary of all alerts, actions, and outcomes
- •Verified savings from resolved issues
- •Deep links to specific alerts and resolution data
One building or a hundred?
EOS grows with you. Same simple overview, no matter how many buildings you have. Fast onboarding, minimal friction.
Your Meters
Electricity, heating, gas, water (depending on availability)
Your Systems
API, CSV export, EMS/BMS data, utility interval data
Your Portfolio
From 1 building to multi-site portfolios
Typical Onboarding Timeline
What we need from you:
- ✓List of buildings with basic info (address, type, size)
- ✓Access to meter data (API or CSV export)
- ✓One contact person for onboarding questions (2-3 hours total)
Real Example: Night Load Drift
How Varig EOS caught a high-consumption issue in 48 hours
Office Building - Night Electricity Baseline Drift
Building 47B, Oslo • Electricity
How it played out:
Before vs After
How Varig EOS Compares
Different approaches to energy management
| Capability | Energy Consultants | Dashboard Tools | Varig EOS |
|---|---|---|---|
| Automated Detection | — | — | ✓ |
| 24/7 Monitoring | — | Manual | ✓ |
| Impact (kWh) | Custom | — | ✓ |
| Resolution Tracking | Via reports | — | ✓ |
| Weather Normalization | ✓ | Sometimes | ✓ |
| Scales to 100+ Buildings | Expensive | Manual effort | ✓ |
| Audit Trail | Reports only | — | ✓ |
| Typical Cost (annual) | €5k–50k | €2k–10k | Contact us |
* Depends on site data availability and integration complexity
Security & Governance
GDPR-Ready
Structured for EU requirements with clear processing agreements.
Data Ownership
Your data stays yours. Export and deletion policies available.
Access Controls
Role-based access and activity logging.
Audit Trail
Issues, actions, and outcomes documented for accountability.
Frequently Asked Questions
Common questions from portfolio managers
Ready to take control of your energy usage?
Talk to us about your EOS needs and we'll get you started.
What happens next:
- 1.We'll review your portfolio structure and data availability (15-min call)
- 2.If it's a fit, we'll run a proof-of-concept scan on 2-3 buildings (free)
- 3.You'll see real alerts (if any exist) before committing to full rollout